Pathway pharmacology · Open data
PathoRx
A study tool for seeing where drugs act on disease pathways. Pick a disease, a drug or a gene, and PathoRx draws the published KEGG or Reactome map with each drug's recorded targets marked on it, what papers say happens next, and what the diagram predicts further along. Every mark says which of those it is.
Opens pathorx.com in a new tab. Not medical advice — a study aid built from public databases.
What you can do
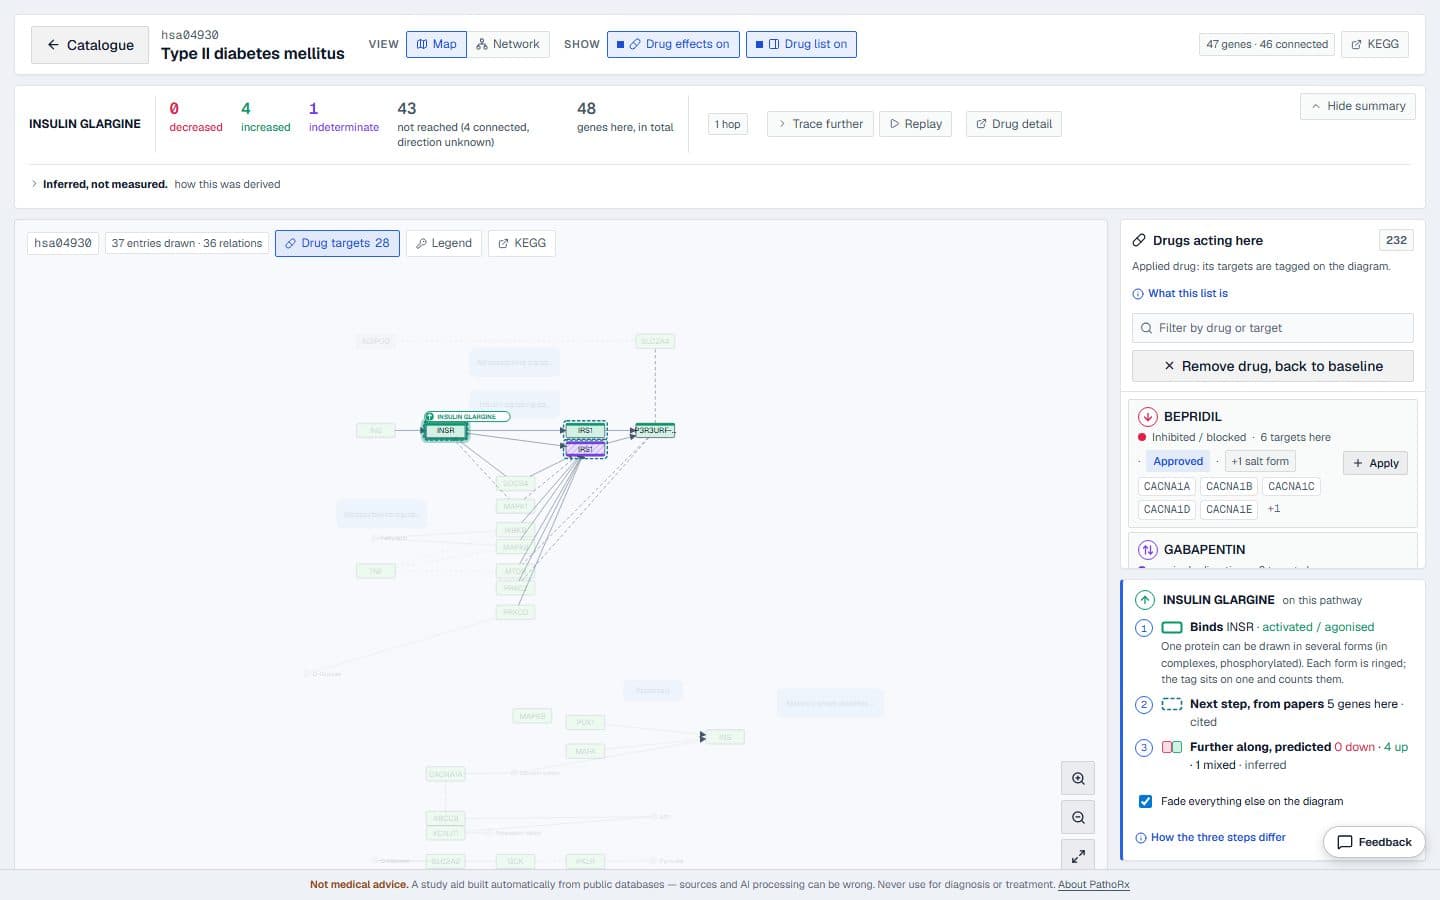
Understand a disease
Open the published pathway map and see which genes are involved and which drugs act on them.
Type 2 diabetes map ↗See how a drug works
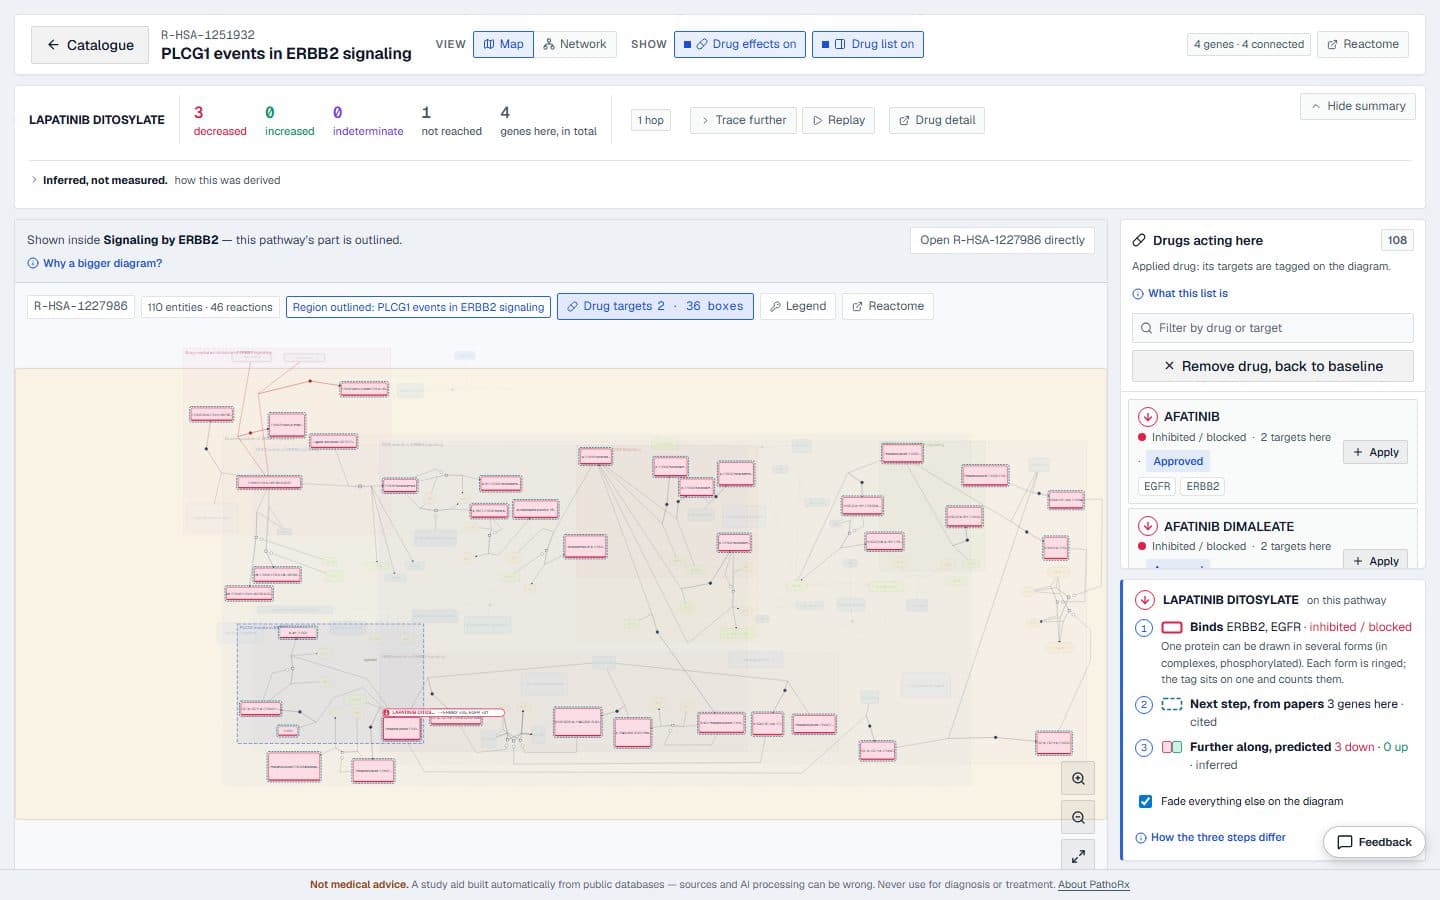
Apply a drug: its targets are tagged on the map, and everything it does not touch fades back.
Afatinib on EGFR signalling ↗Look up a gene
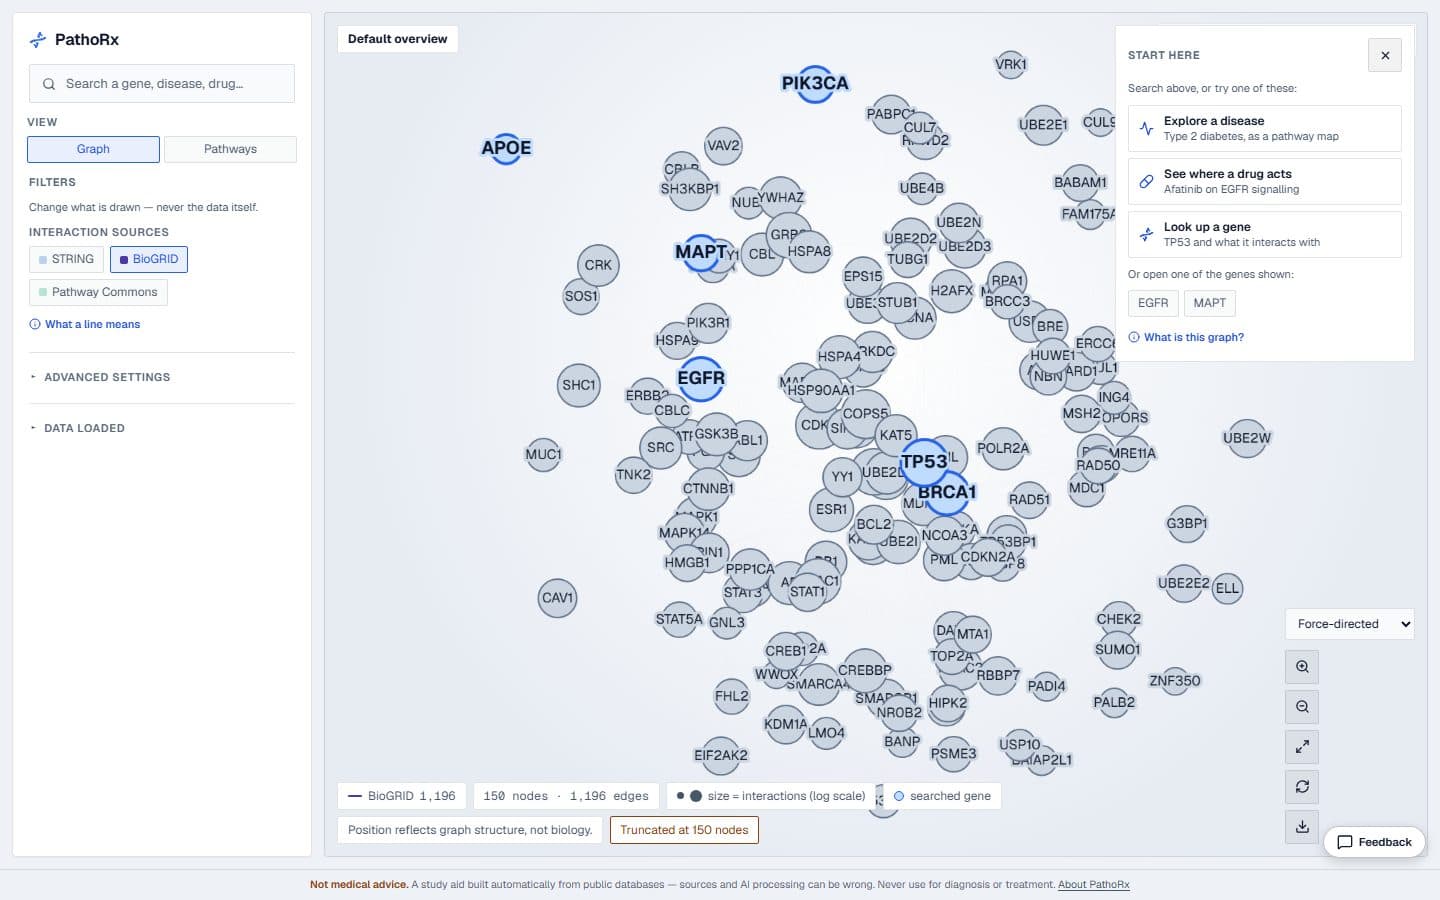
Search any gene for its interaction partners, the pathways it sits in, drugs against it and linked diseases.
Search PathoRx ↗Every mark says what kind of claim it is
A colour on a pathway map can mean a measurement, a citation or a guess. PathoRx keeps those three apart and labels each one where it appears.
Recorded
What a database recorded: the drug's targets and action from ChEMBL, and one-step statements from SIGNOR, each with its PubMed citation, species and the quoted sentence.
Predicted
What the drawn diagram implies further along — signs multiplied along its arrows. Always labelled as inferred, never mixed with the cited layer.
Measured
Expression changes measured in cell lines (LINCS L1000), shown in words beside the map and never on the prediction's colour scale.
Built on public data
- KEGG — pathway maps and relations
- Reactome — pathway diagrams, complexes and reactions
- WikiPathways — community pathways
- ChEMBL — drug targets and mechanism of action
- SIGNOR — cited causal statements
- LINCS L1000 — measured expression changes
- STRING · BioGRID · Pathway Commons — interaction networks
- DisGeNET · OMIM · MONDO — gene–disease links and disease terms
- SIDER — side effects